Mechanical properties
Stiffness
The graphic below shows the Young’s modulus range for thermoplastic polyurethanes and RTPU compared to other engineering plastics.
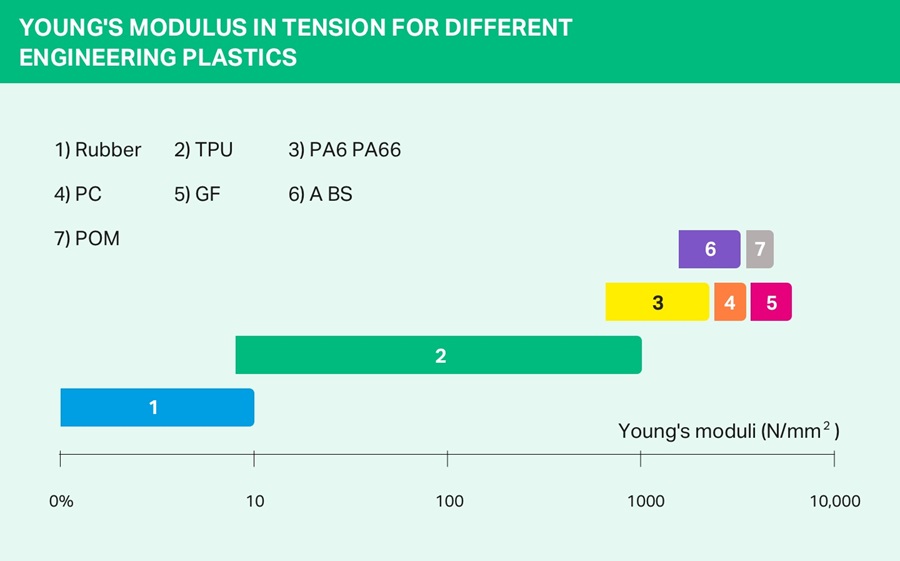
Young’s
modulus (modulus of elasticity) is established by conducting the
tensile test in accordance with DIN 53504 on an S1 specimen defined by
DIN EN ISO 3167, employing a testing rate of 2 mm/min. Young’s modulus
is calculated as the ratio of stress to strain along the initial slope
of the stress-strain curve.
For plastics, laboratory testing has shown that Young’s modulus depends on the following parameters:
• Orientation of the macromolecules and fillers
• Temperature
• Moisture content
• Stress rate and duration
• Specimen geometry
• Test setup
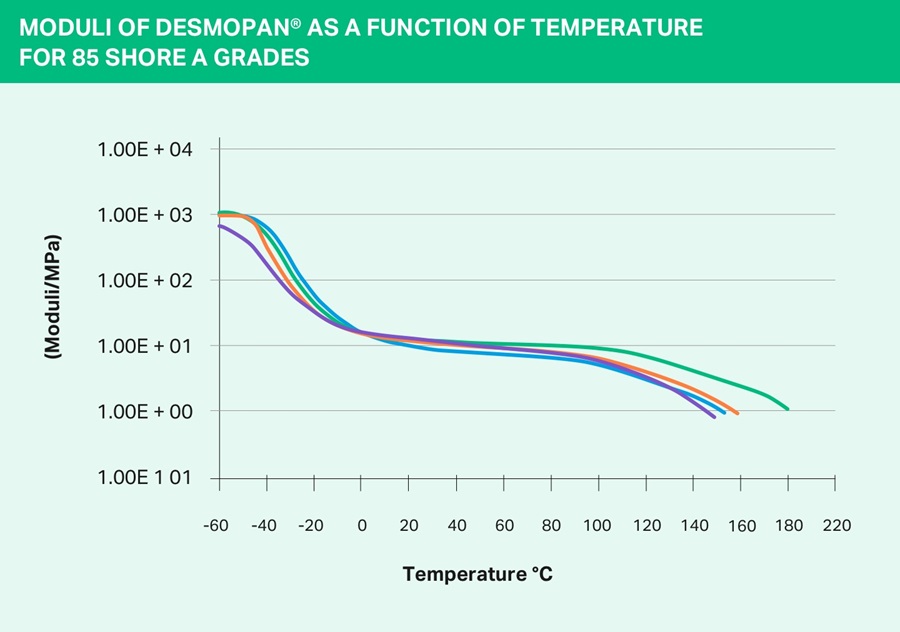
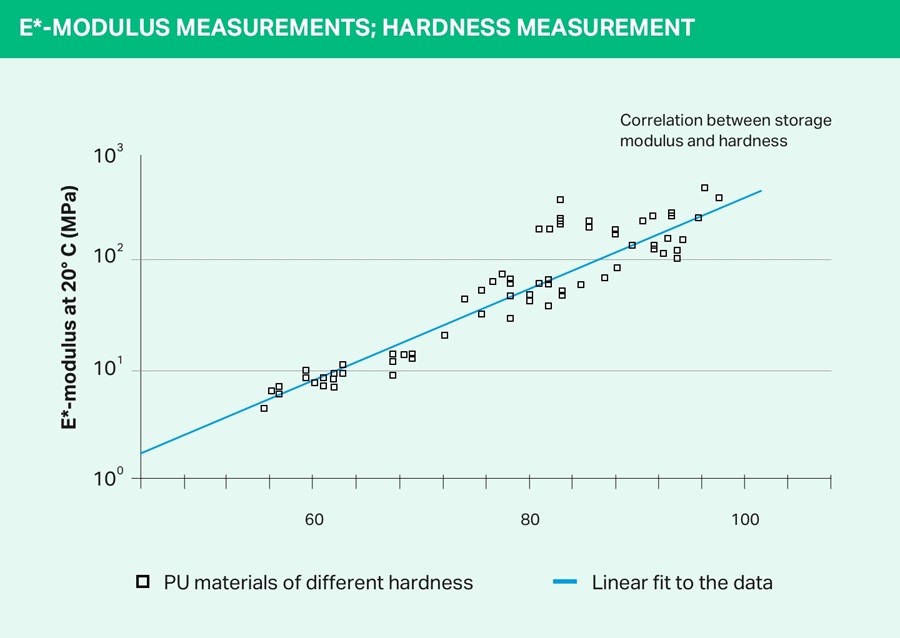
Stiffness as a function of temperature
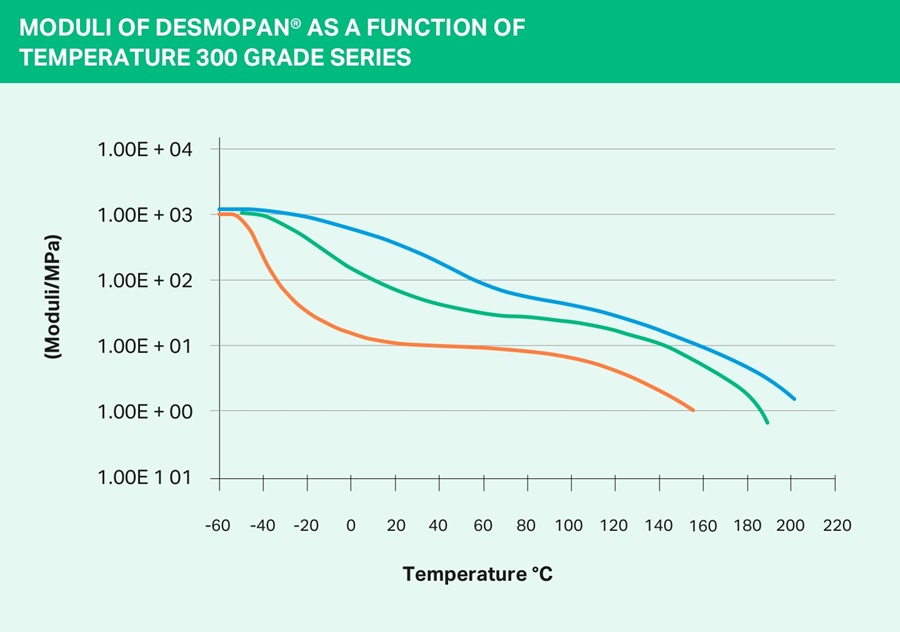
The
relationship between stiffness and temperature is shown in the
following two diagrams for different raw materials and hardness values.
Shore hardness A and D
The thickness of the part to be tested should be at least 4 mm (based on experience, 6 mm is preferable). It is permissible to stack some thinner parts, but they must maintain close contact. As for the values, a hardness of Shore A applies to soft elastomers. The hardness tester for this range has a blunted tip. If values above 90 Shore A are measured, the hardness tester for Shore D should be used. A hardness of Shore D applies to harder elastomers or plastic materials. The tester for this range has a pointed tip. If values below 20 D are read, the Shore A hardness tester should be used. Plasticizer-free Desmopan® can be obtained in a hardness range of 60 Shore A to 75 Shore D. Please note that additive coatings such as wax on surfaces lead to a penetration, rather than indentation, of the surface. Such additives can therefore produce incorrect results. We advise cleaning specimens with alcohol prior to testing. After the specimen is fully dry, the test can be conducted under standard conditions (23°C/50% rel. hum.).
Glass transition temperature
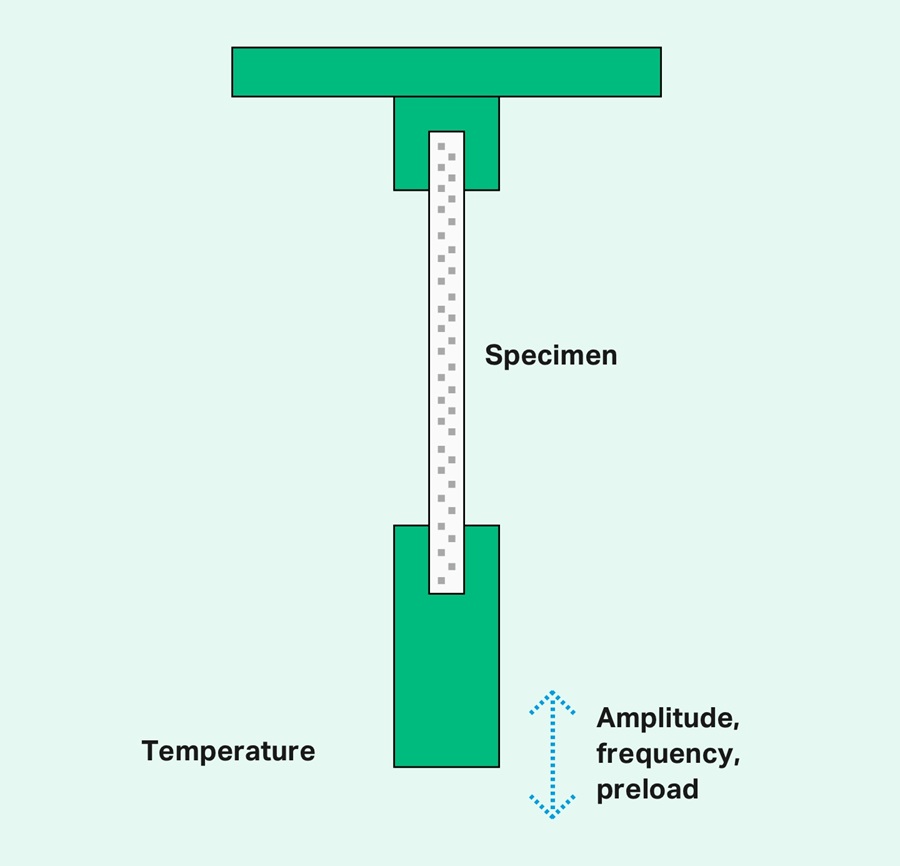
Dynamic mechanical analysis (DMA)
• Viscoelastic material properties, such as various moduli and the loss factor tan (δ)
• Temperatures that characterize viscoelastic properties
• Damping
• Glass transition temperature, in particular (for which DMA is the most sensitive method)
• Frequency-dependent mechanical properties of materials
In DMA (analysis of the tensile modulus/complex modulus of elasticity), a very small fluctuating mechanical sinusoidal stress is applied to the test specimen (which is under a constant preload, which may be dependent on the storage modulus), with variation of temperature over time. This setup results in deformation of the specimen in phase. The parameters measured are the force amplitude, deformation amplitude and phase displacement Δ φ between the force and deformation signals. The preload is used to keep the specimen sufficiently tensioned at the time of negative dynamic deformation amplitude. The DMA yields the complex modulus of elasticity of the specimen. A prerequisite here is that the specimen is not subject to stress outside the linear elastic region (Hooke’s region); see Figure 1. The specimens may react in one of three ways:
• Perfectly elastic specimens react immediately to the applied force, the phase angle φ = 0. They oscillate without loss.
• Perfectly viscous specimens reach their deformation maximum at the crossover point of the force. Their phase angle φ = π/2 (90°). They convert the excitation energy entirely into heat.
• Viscoelastic materials, such as Desmopan®, exhibit a certain lag in the deformation of the specimen after the application of force. Therefore, for the phase angle Δ φ, 0 < φ < π/2. The greater the phase angle, the more pronounced the damping of the oscillation.
• Softening behavior, heat resistance
• Glass transition temperatures
• Plasticizing effects
• Niveau of modules
• Phase characteristics
• Morphology, crystallization and melting
• Flow process
Test parameters:
• Heating at 0.1 K/min up to 10 K/min; adjustable
• Temperature range: -150°C to +300°C
• Frequency: 0.01 to 20 Hz in 1-2-5 sequences, adjustable
• Thickness of specimen: 0.1 to 2 mm
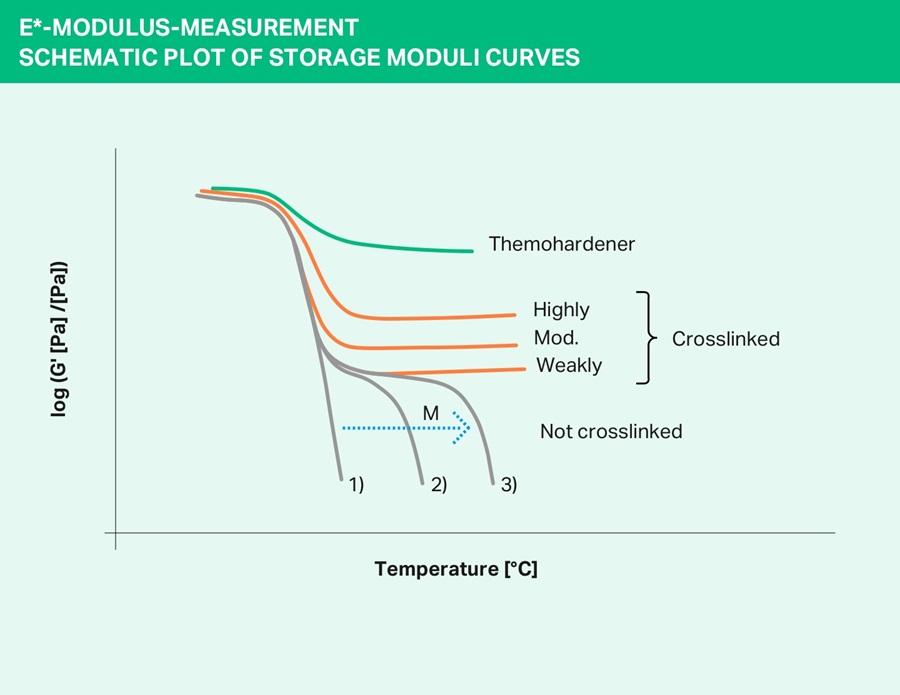
If the storage modulus drops substantially into the region of the glass transition temperature and then remains at a more or less high level up to final softening, it is an elastomer, crosslinked to varying degrees, or a thermoplastic elastomer (e.g., thermoplastic polyurethane), depending on whether the final softening involves melting without decomposition or a decomposition process. If the storage modulus falls further with varying rapidity after passing through the glass transition temperature, the material is a non-crosslinked polymer with a low or high molecular weight.
This is the standard method for the (mechanical/thermal) determination of glass transition temperature, plasticizing effects, phase behavior or multiphase systems and the corresponding morphological structures, the miscibility of polymers and the melting and crystallization properties of partially crystalline phases. In particular, it permits an analysis of the different reasons for softening and an attribution to molecular processes (the glass process) of an amorphous phase or melting (crystalline phases).
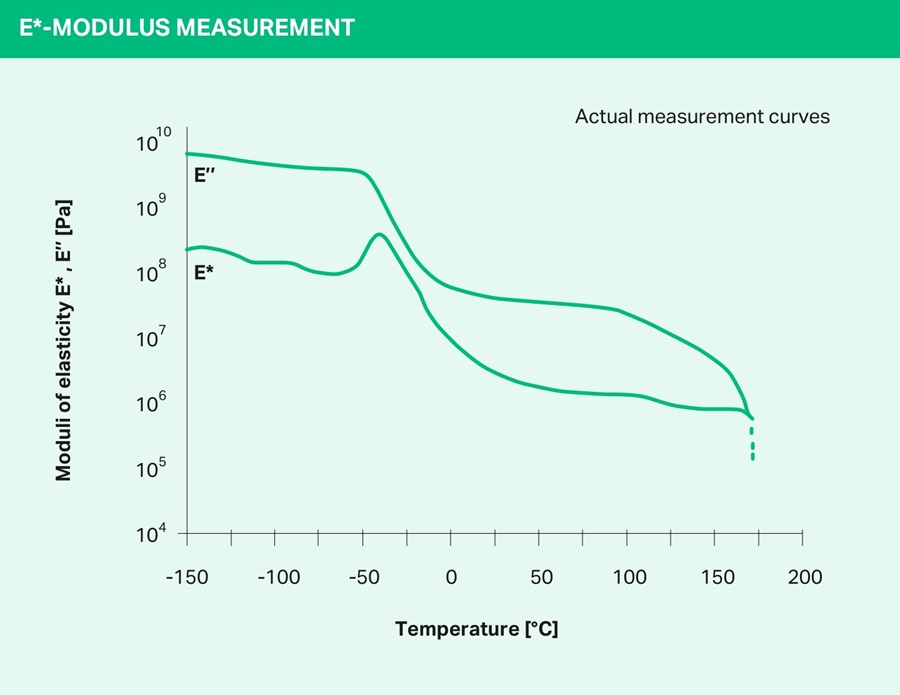
The glass transition at the maximum of the loss modulus E” is apparent; the glass transition temperature can be determined with a precision of 0.1°C since it is defined here by a maximum. The two-stage softening of the TPU material is attributable to the melting of a partially crystalline soft phase, which follows a broad softening of an amorphous hard phase. In molecular terms, the glass process differs substantially from the melting of a material. The glass process is a cooperative molecular relaxation process of main chain segments of the polymer, which has an activation energy based on the time-temperature-equivalence principle and therefore proceeds at different excitation frequencies at different temperatures. The temperature at which softening is observed upon melting of a material, however, is only dependent on its specific melting temperature, and not on the frequency of its dynamic excitation.
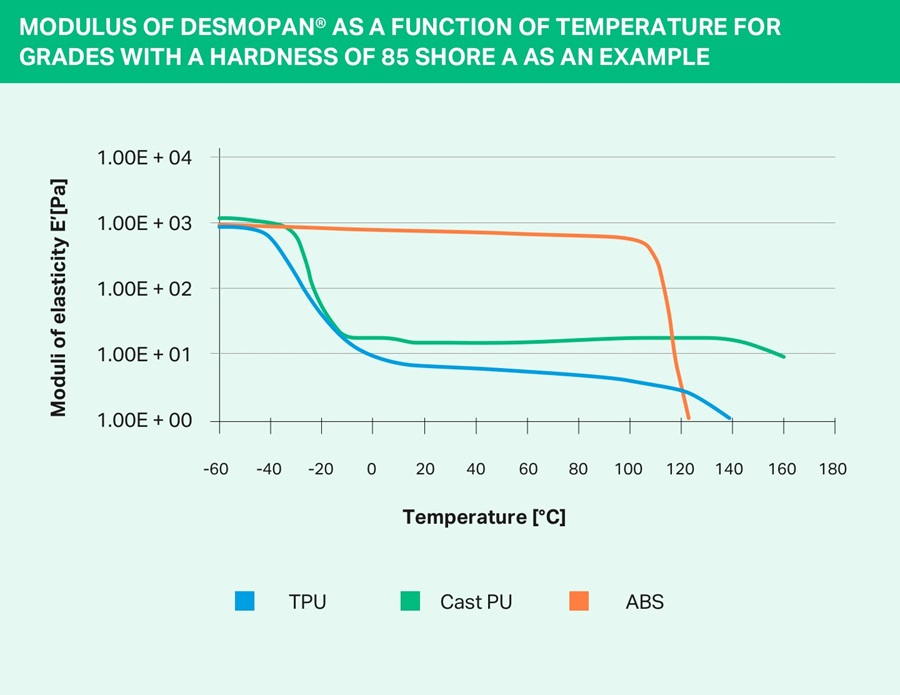
In Figure 4 below, the modulus of elasticity of a selected Desmopan® grade is compared to that of a cast PU and a hard thermoplast (ABS).
Tensile strength
Test results for Desmopan®:
Stress and strain data, including:
• Modulus of tension Et [MPa]
• Modulus at 100% strain (MPa)
• Modulus at 300% strain (MPa)
• Tensile stress at break σB [MPa]
• Elongation at break εB [%]
• Other characteristic values on request
Standards: DIN 53504, measured on an S1 test specimen with a displacement rate of 200 mm/min.
Tear propagation strength
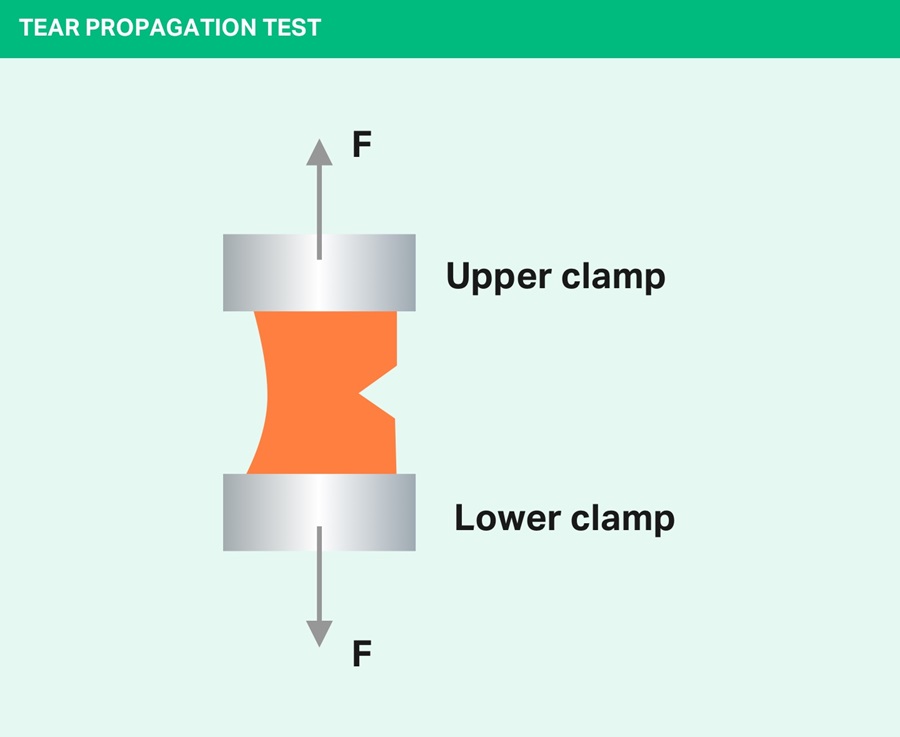
The test is carried out according to DIN ISO 34-1Bb on angled test specimens with an incision. These are pulled, perpendicular to the incision, at a velocity of 500 mm/min until they are torn apart. The tear propagation strength [kN/m] is the quotient of the highest force attained and the specimen thickness.
Results of the test method:
• Tear propagation strength [kN/m specimen thickness]
In terms of its tear propagation strength Desmopan® is far superior to the majority of plastics. Very soft grades attain around 30 – 40 kN/m, while very hard grades can achieve values of more than 200 kN/m.
The test setup for the tear propagation strength test is shown in the diagram below.
Compression set
As laid out in DIN ISO 815, the compression set is measured with a constant deformation. To determine the compression set, a cylindrical test specimen is compressed by a percentage that is calculated on the basis of the material’s hardness. The specimen is then stored at a given temperature for a certain period of time in the compressed state. The temperature used for the compression set test depends on the material to be tested, its intended purpose and the test setup (e.g. 24 hours at 70°C for seals). 30 minutes after the pressure has been removed, the height of the specimen is measured again and, based on this value, the residual deformation established.
A compression set of 0% means that the specimen has regained its full original thickness (which is only possible in theory), while a compression set of 100% indicates that the specimen underwent a complete deformation during the test and shows no sign of recovery.
The calculation is based on the formula:
CS (%) = (L0 – L2) / (L0 – L1) x 100%, where:
• CS = compression set in %
• L0 = height of specimen prior to the test
• L1 = height of the specimen during the test (spacer)
• L2 = height of the specimen after the test
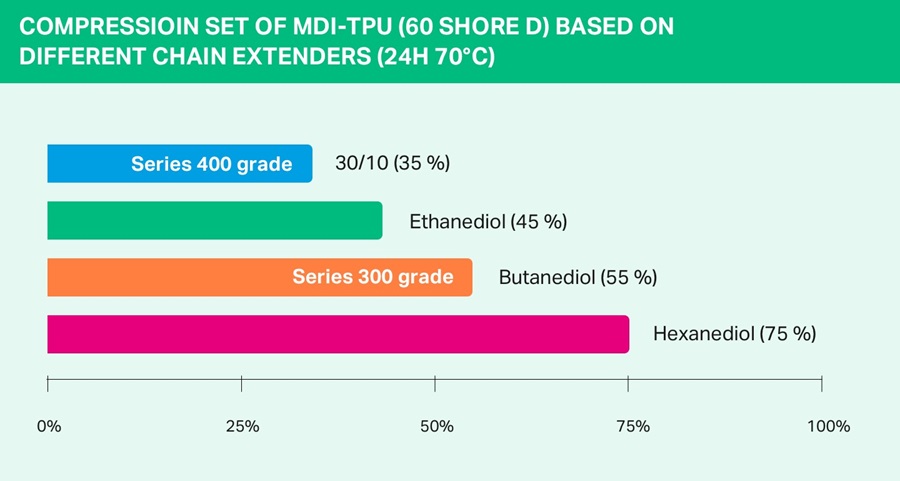
To illustrate the significance of this test, take a rubber component like a seal, for example: When the seal is fitted, it is compressed to a certain thickness and exerts compression on the sealing surfaces. The strength of compression goes down over time, since the seal undergoes plastic deformation. If this plastic variable, i.e. the compression set, is too high, the compressive force and hence the sealing effect will be reduced to such an extent that leaks can occur (either at individual points or over the full surface of the seal), particularly if the seal is poorly sized. As a rule of thumb, the compression set for flat seals should not exceed 40% at the continuous service temperature. The following diagram shows the compression set that can be attained on average when using different types of chain extenders. This is one of the means by which it is possible to influence the crystallinity of the rigid segment and the phase separation – as the most important parameters. While Desmopan® grades in the standard ester series (100–300 series) generally have a compression set ranging between 45 and 55% (24h/70°C), considerably more favorable compression sets between 30 and 35% (24h/70°C) can be achieved through the use of special raw materials in the special ester series (400 series). The first Desmopan® products with a technically serviceable compression set at 100°C or 120°C are currently under development.
Impact strength
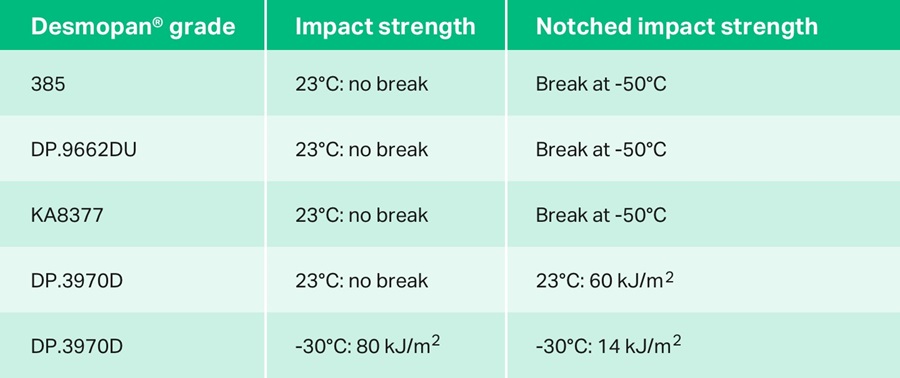
• Impact strength aiU [KJ/m2]
• Notched impact strength aiN [KJ/m2]
• Plus, an assessment of specimen fracture at the corresponding temperature and, where appropriate, a tough/brittle transition.
Friction
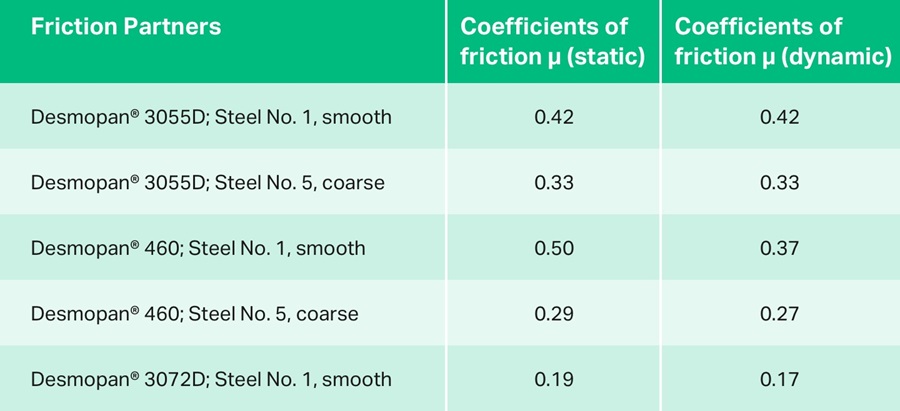
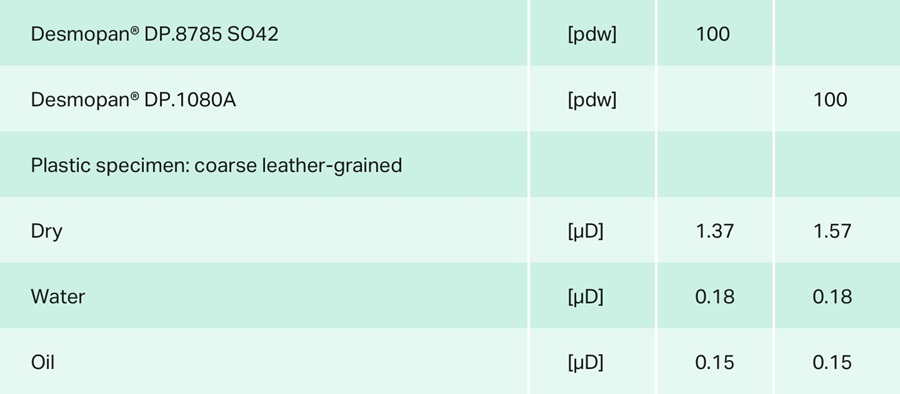
Specimen: leather-grained flat specimen 50 x 50
Friction partner: polished steel
Test weight: 2000 g
Mean sliding friction: µD
Poisson’s ratio
unom = -ey,nom / ex,nom,
whereby the nominal elongations represent the relative change in length (DL) or in width (DB) with reference to the initial dimension of the measuring region according to
ex,nom = DL/L0 ey,nom = DB / B0.
Poisson’s ratio can also be used to determine whether a material maintains a constant volume when deformed or whether the volume increases under deformation, e.g. due to the formation of microcracks and voids.
Rather than using the nominal Poisson’s ratio (see above) for this purpose, it makes sense to use the so-called Hencky ratio:
uH = -ln (1 + ey,nom) / ln (1 + ex,nom),
as this remains constant in the case of volume change with constant form, while the nominal Poisson’s ratio declines logarithmically (e.g. at constant volume).
For small elongations, in particular in the linear-elastic deformation region, which is relevant for normal simulations, the Hencky elongation and the nominal elongation have the same value, so the corresponding ratios are also identical within this region.
Determination of the Poisson’s ratio is carried out on a tensile test machine using the gray value correlation method. This involves tracking changes in the local elongation using an arbitrary dot pattern. The following table shows the Hencky ratios for selected types of Desmopan® – whereby it should be noted that this ratio is identical to the nominal Poisson’s ratio in the linear-elastic region.

Abrasion
